
Service
The service offered includes all work from library preparation to data analysis, and consists of the following blocks:
- Preparation of single cell/spatial libraries
- Sequencing (Illumina NovaSeq6000)
- Data analysis
User can choose either block 1 only, block 1 and 2, or block 1, 2 and 3.
Users are responsible for nuclei/cell isolation and fixation. Fixation allows for storage of nuclei suspensions and provides a more practical experimental workflow. This option is available only when using the 10x Genomics Flex and Parse kits, but not with the 10x Genomics Universal 3' or 5' kit. For the latter nuclei/cells must be isolated and delivered to our facility on the same day, limiting it to 2–4 samples per day. Additional information about selecting the appropriate technology is available on the subpage TECHNOLOGIES.
Offered technologies
Single cell omics
- 10x Genomics Universal 3’ Gene Expression (no sample fixation)
- 10x Genomics Universal 5’ Gene Expression (no sample fixation)
- 10x Genomics Flex Gene Expression with sample fixation and multiplexing of samples (only human or mouse samples)
- 10x Genomics Epi Multiome ATAC + Gene Expression (tentatively available in fall 2025)
- Parse EvercodeTM WT Mini (up to 12 samples), EvercodeTM WT (up to 48 samples), and EvercodeTM WT Mega (up to 96 samples) with sample fixation
- Smart-seq2 (full-length transcript coverage) (tentatively available in fall 2025): example
- Patch-seq (tentatively available fall 2025): original paper 1 and paper 2
Spatial omics
- 10x Genomics Visium Spatial Gene Expression (tentatively available in fall 2025)
- 10x Genomics Visium HD Spatial Gene Expression (tentatively available in fall 2025)
Data analysis
There will be two rounds of data analysis. In the initial round, all data from standard pipelines is delivered (specific requests can be discussed in an initial meeting), including an interactive application for the user to assist with further data analysis (example). In the final round user-specific adjustments are made and publication-ready figures are delivered.
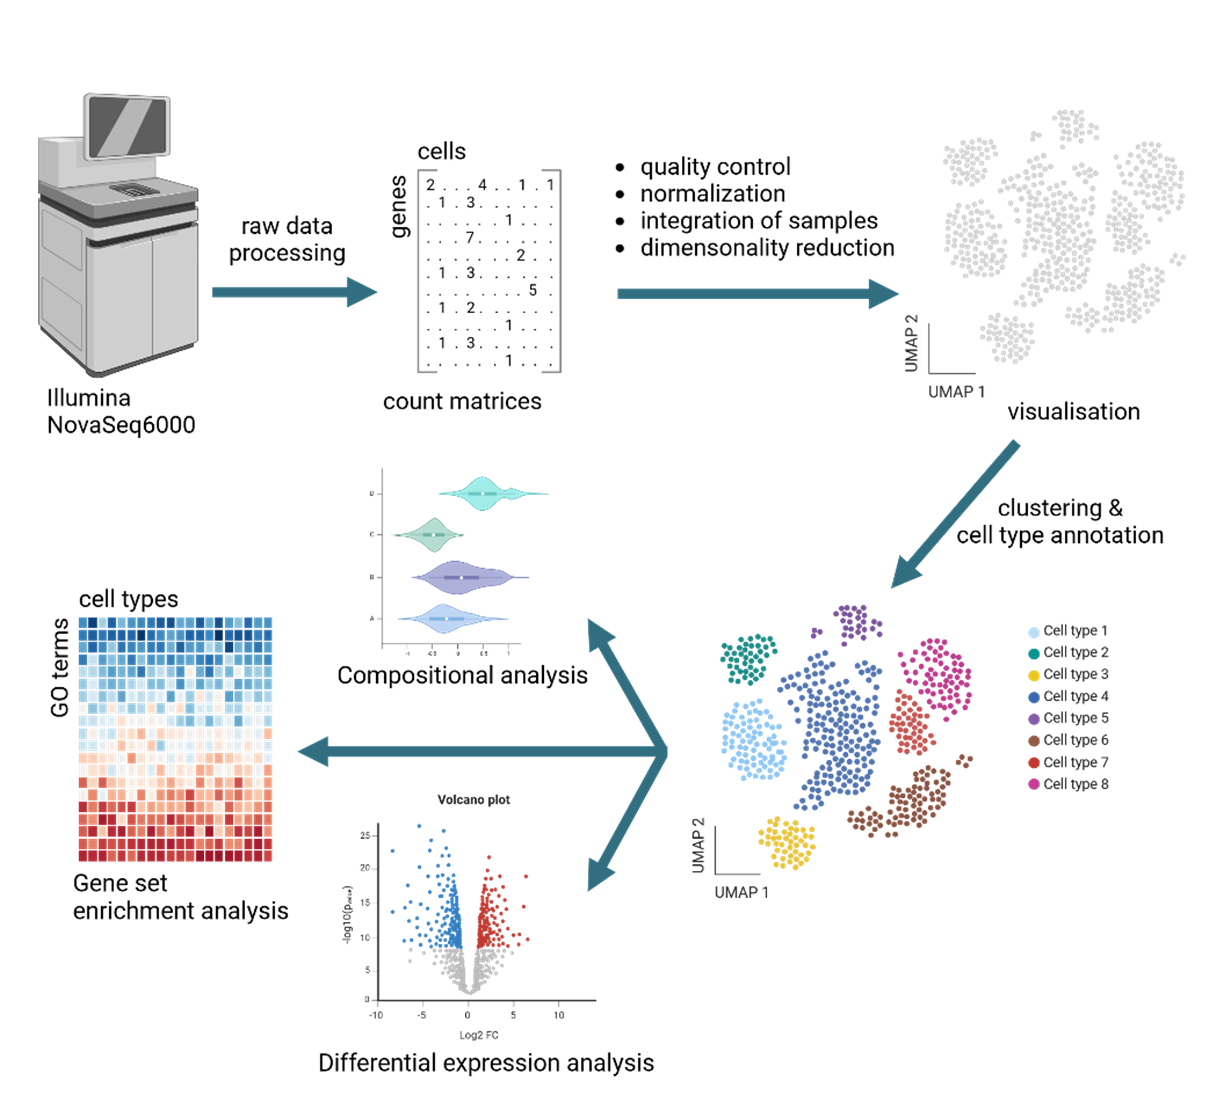
Overview of analysis steps for single cell transcriptomics data.
The raw sequencing data is transformed into count matrices. After quality control and normalization, the samples are integrated and visualized in a UMAP graph. This is followed by cluster estimation and cell type annotation. Standard downstream analysis includes compositional analysis, differential gene expression analysis and gene set enrichment analysis. Additional analyses are available upon request. Figure created with biorender.com.
Standard analysis pipeline for small-scale single cell omics
See also our github repository for example code and plots: https://github.com/NeuSiC/scRNAseq_R_code
1) Raw data processing
- generate fastq files
- produce count matrices
- initial quality control of sequencing and cell calling
2) Quality control of cells (CRMetrics)
- remove low-quality cells based on UMI counts (example) and mitochondrial read fraction (example)
- remove potential doublets (example)
- optional: CellBender to remove ambient RNA (example)
3) Initial data analysis (conos)
- normalization, pre-processing (pagoda2)
- integration of different samples/conditions
- dimensionality reduction
- clustering
4) Cell type annotation
- automated cell type annotation
- or optional performed by user
5) Differential analysis (cacoa):
- Compositional changes (example)
- Transcriptomic expression shifts (example)
- Inspection of sample differences (example)
- Differentially expressed gene analysis (example)
- Genes set enrichment analysis (example)
Additional analysis (user-specific)
- Cluster-free differential analysis (cacoa)
- Cell-cell interaction (CellChat)
- Cellular trajectory analysis: pseudotime (slingshot) or RNA velocity (scVelo)
- Integration with genetic data (GWAS) (CELLECT)
- Gene regulatory networks (CollecTRI + decoupleR)
More analysis tools are available upon request.